Infographics
Data visualization allows you to present complex information in a graphical form, making it easier to compare and read. As part of a visual identity, these visual elements help create brand value across all touchpoints. Such principles make it easy for customers to understand information, as well as make it easier for employees to formulate relevant information both inside and outside the company. All of this happens within a well-defined visual identity.
Downloads files
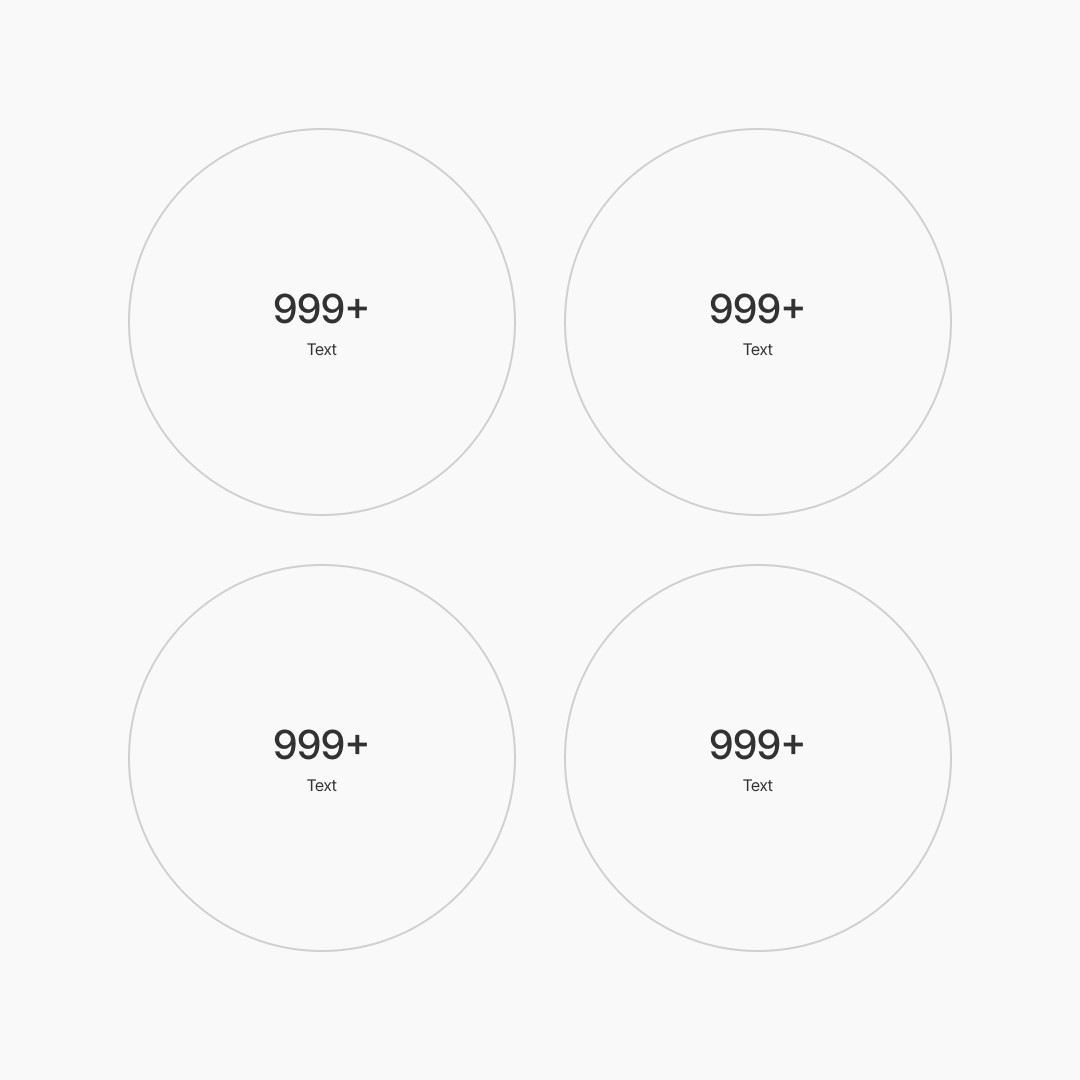
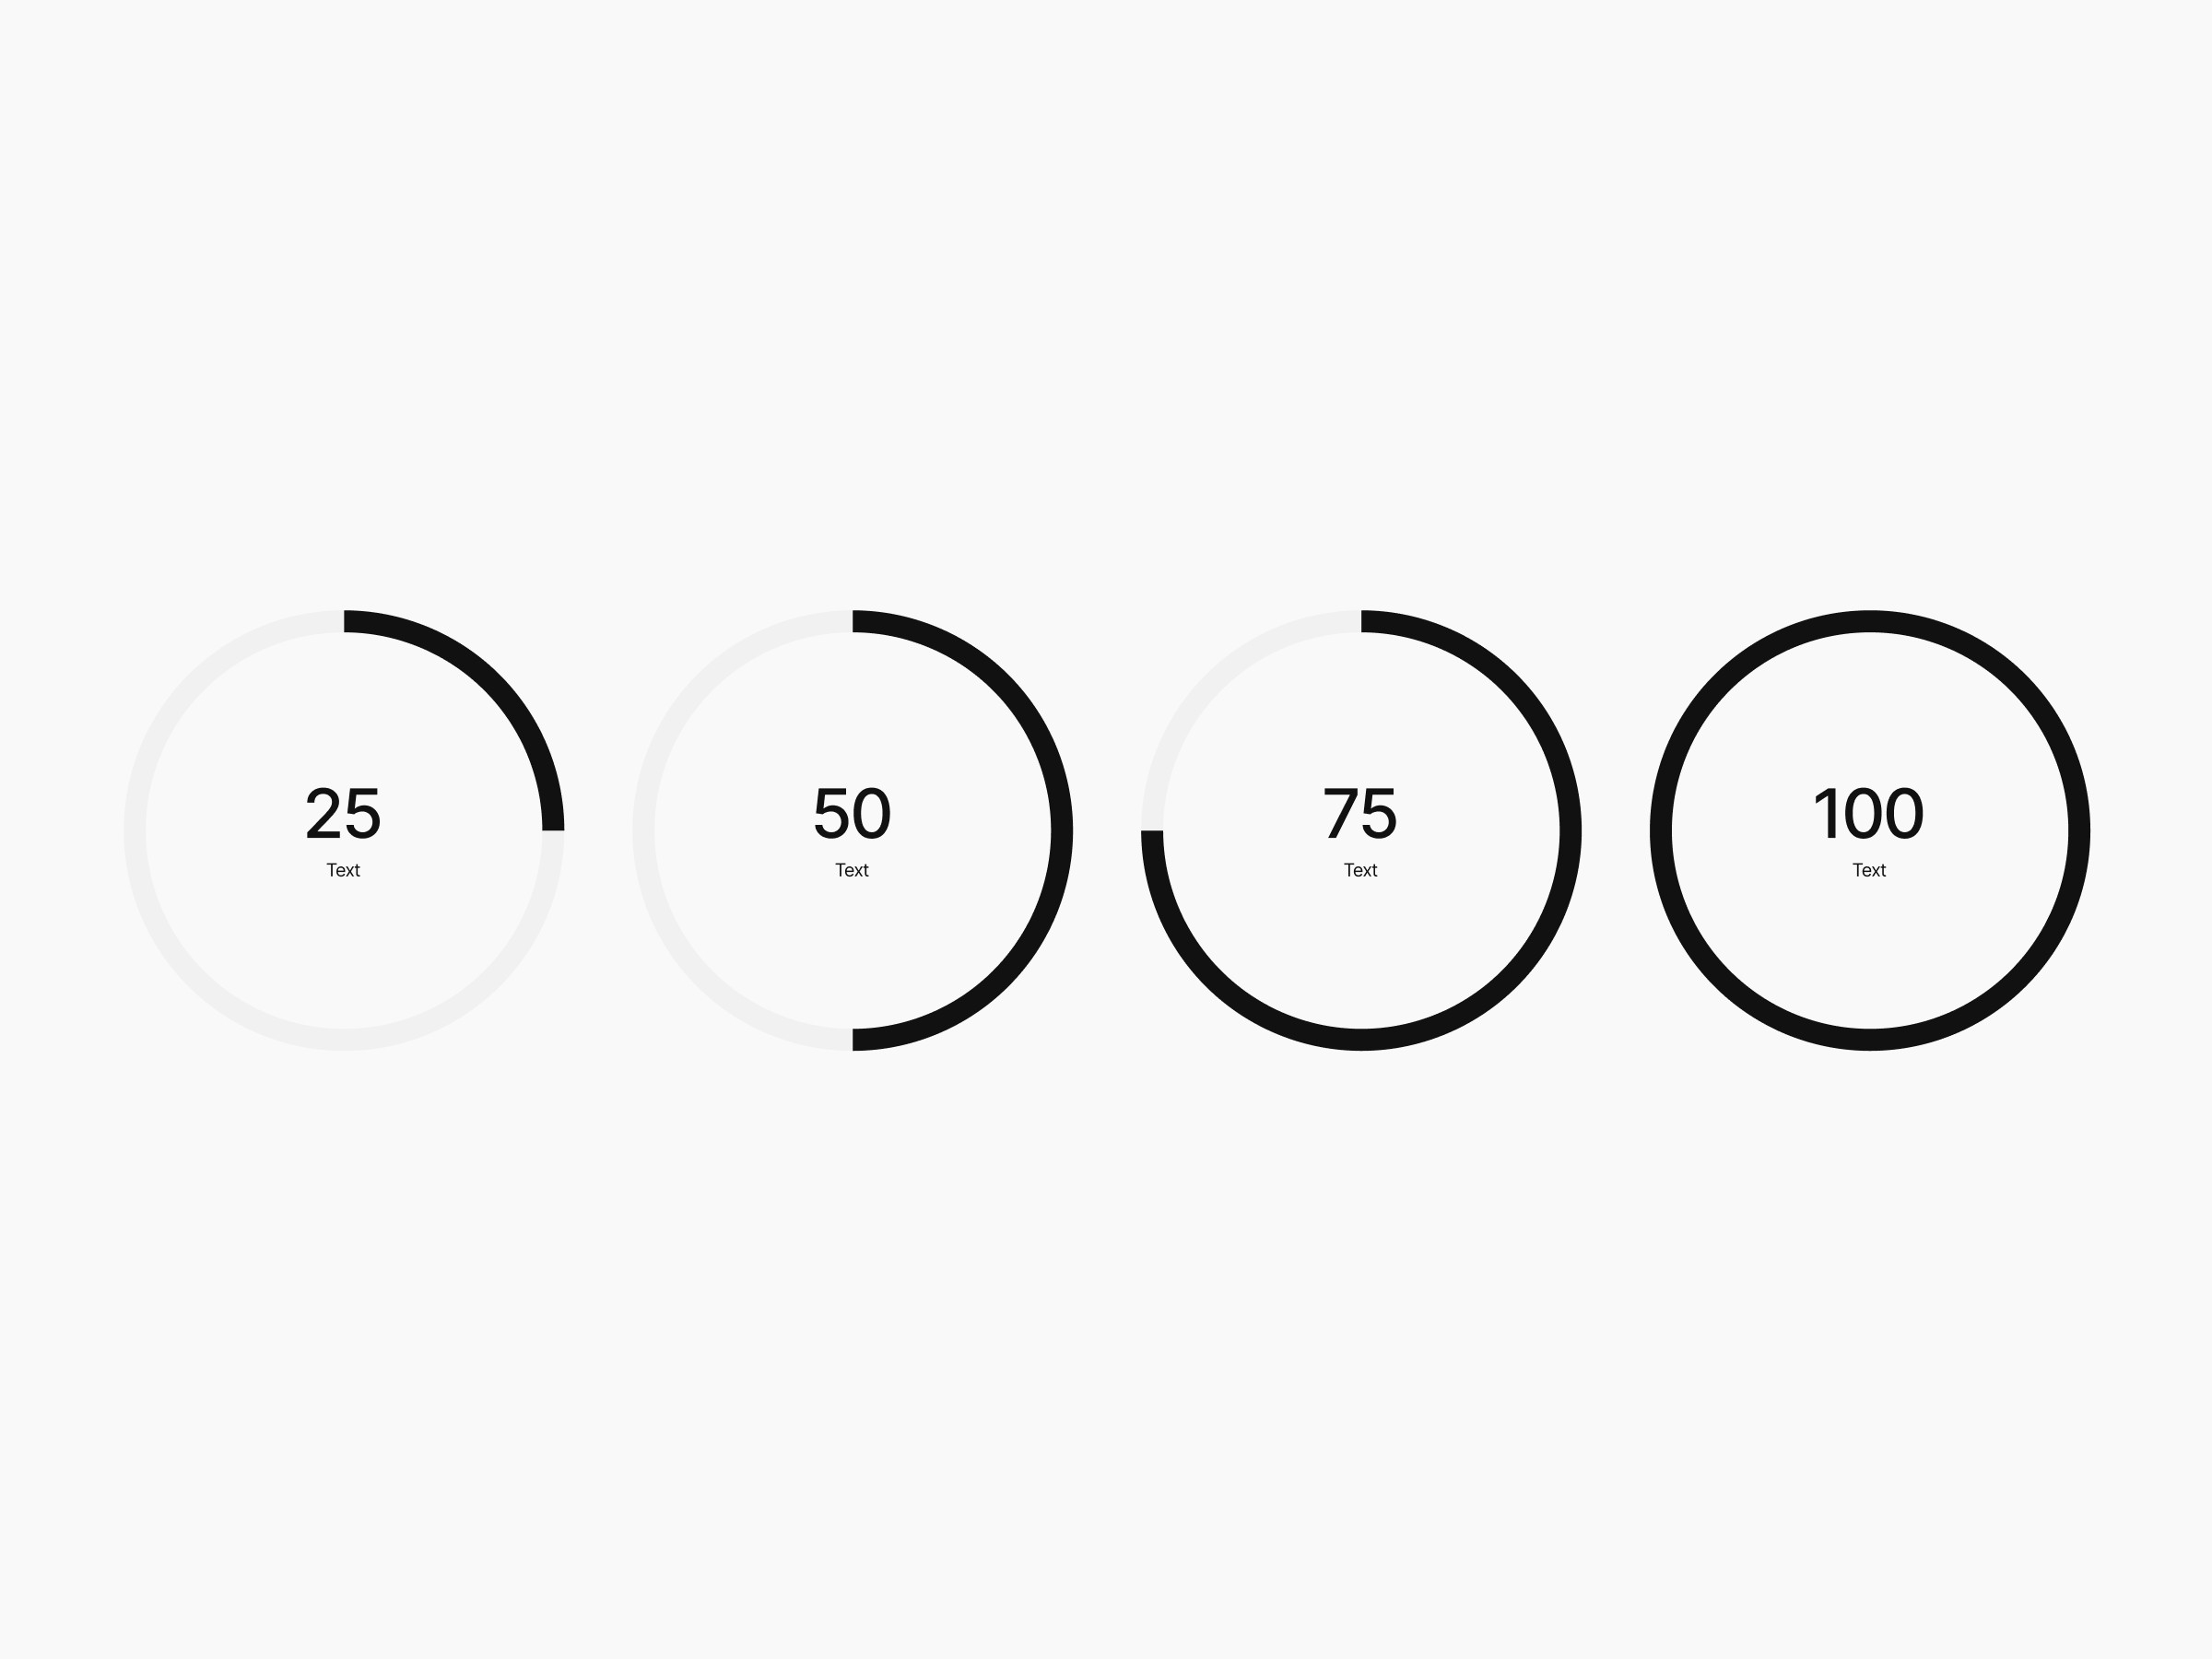
Diagrams
The basic forms of the circle and square are the starting point for our infographics. This helps us design and execute in a clear and digestible way.
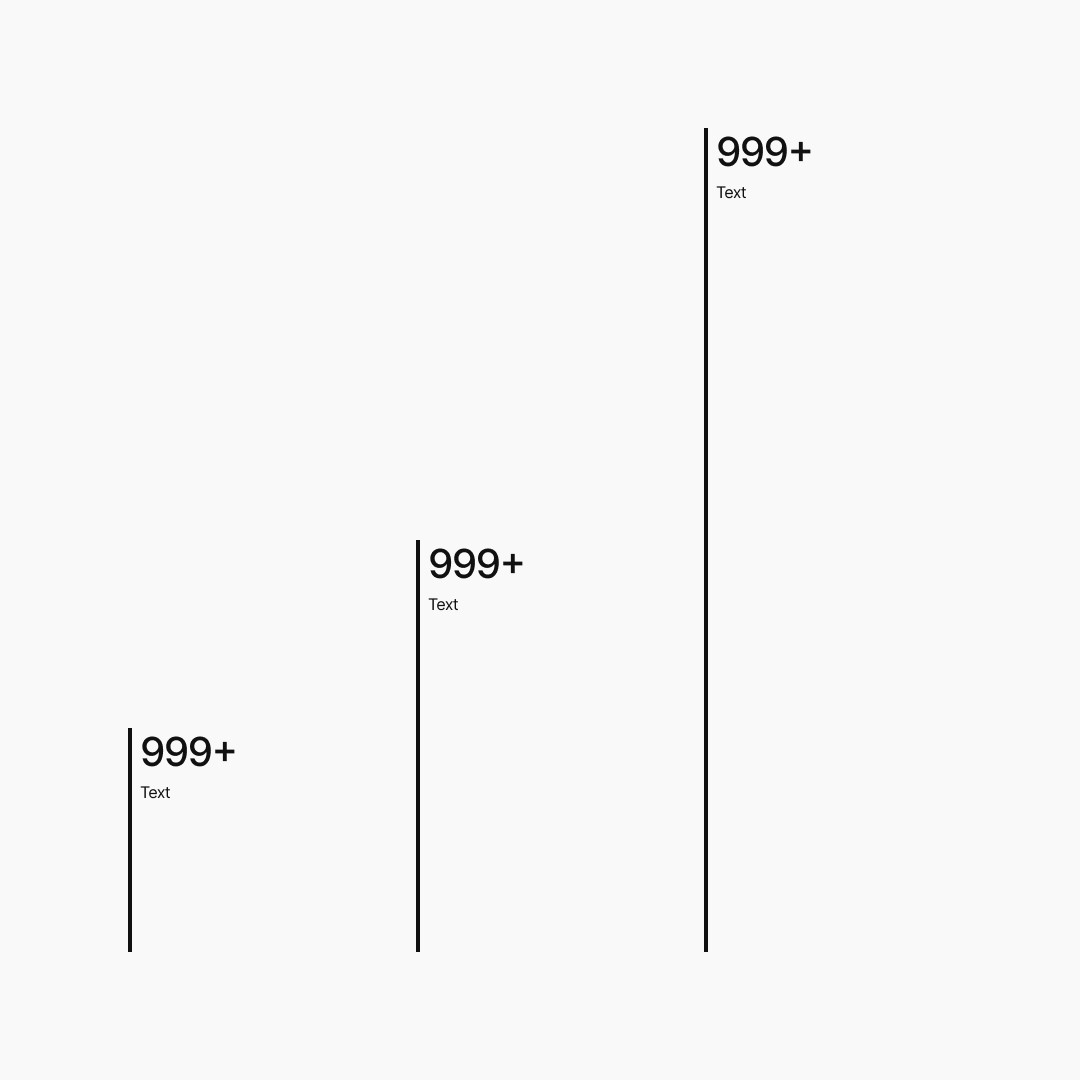
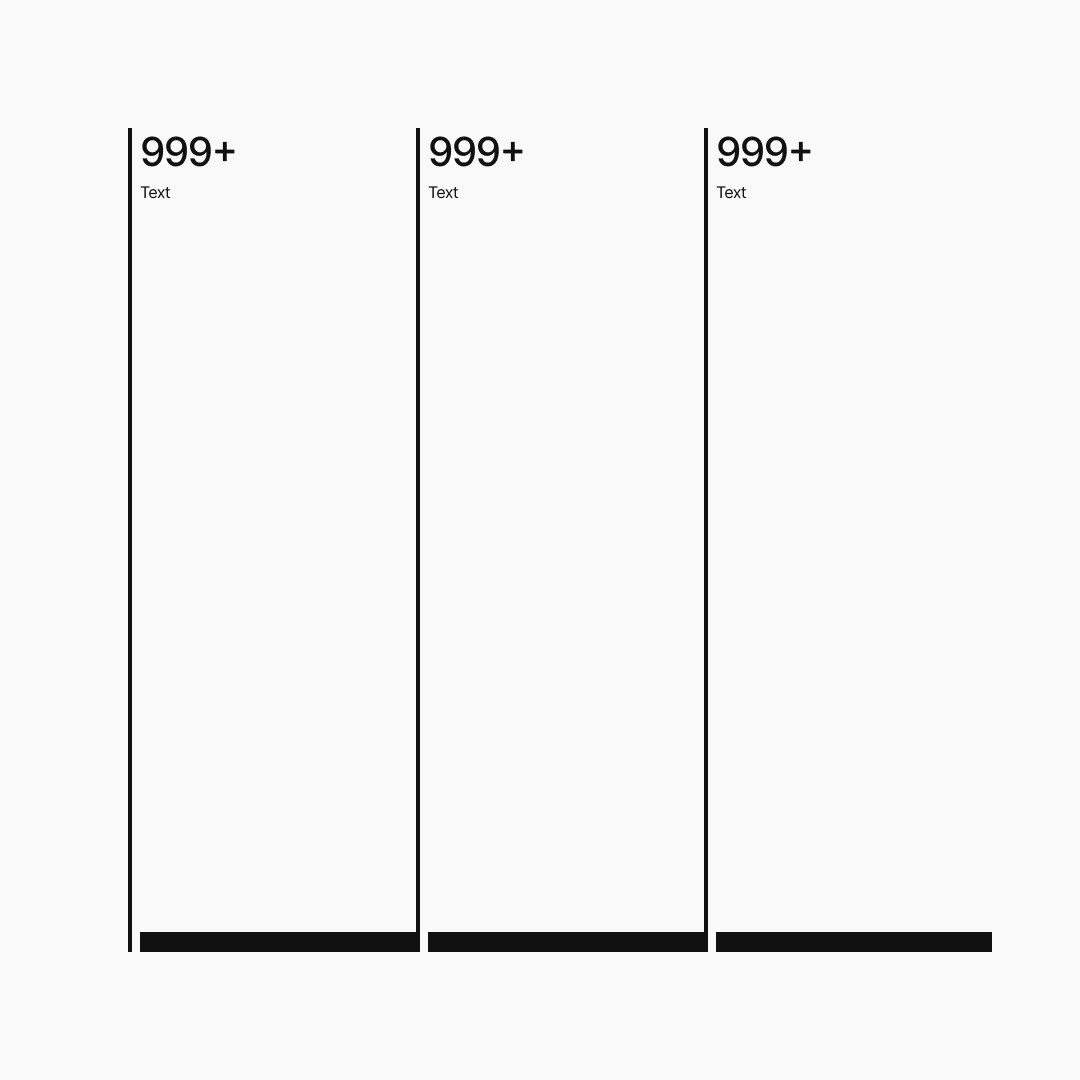
Vertical with stroke
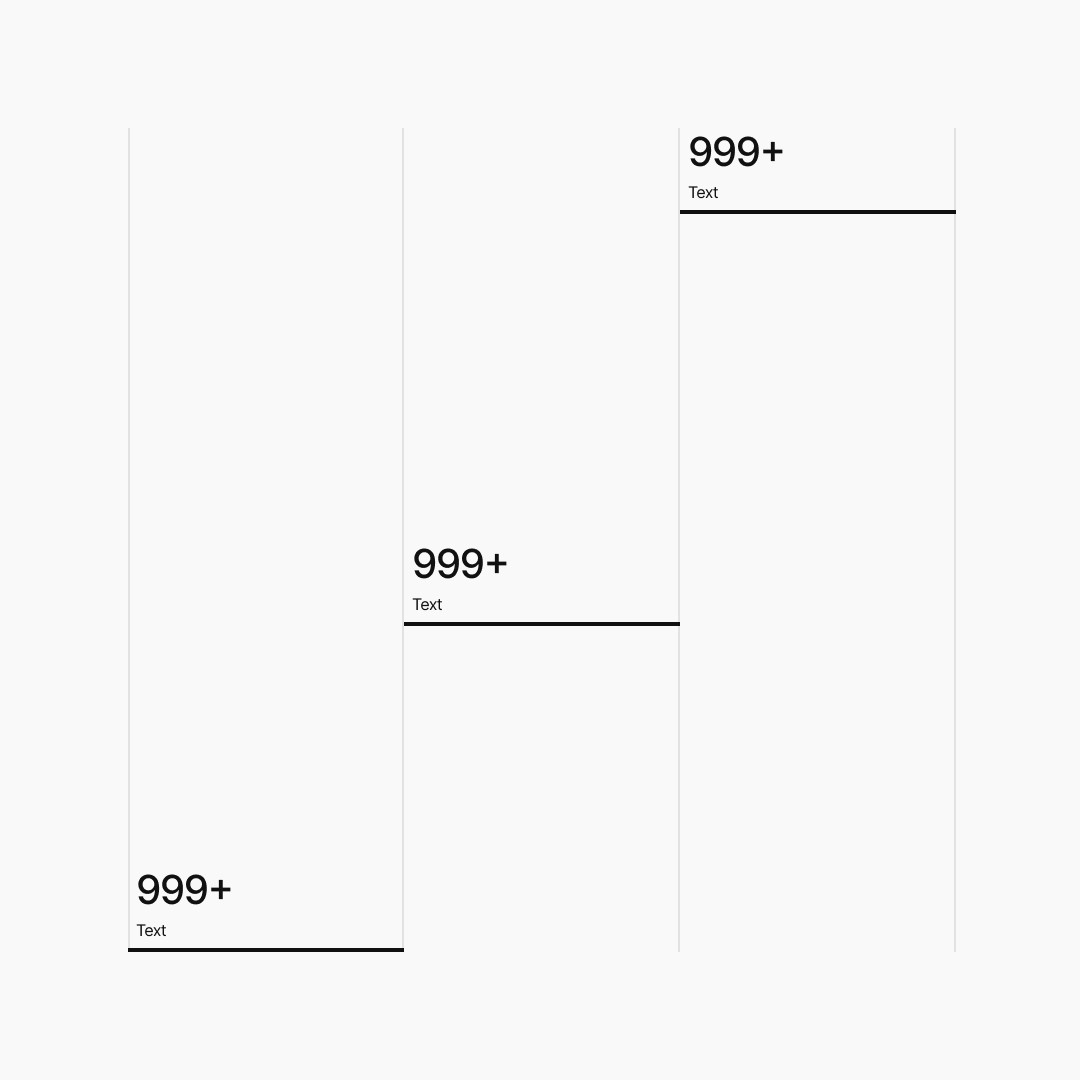
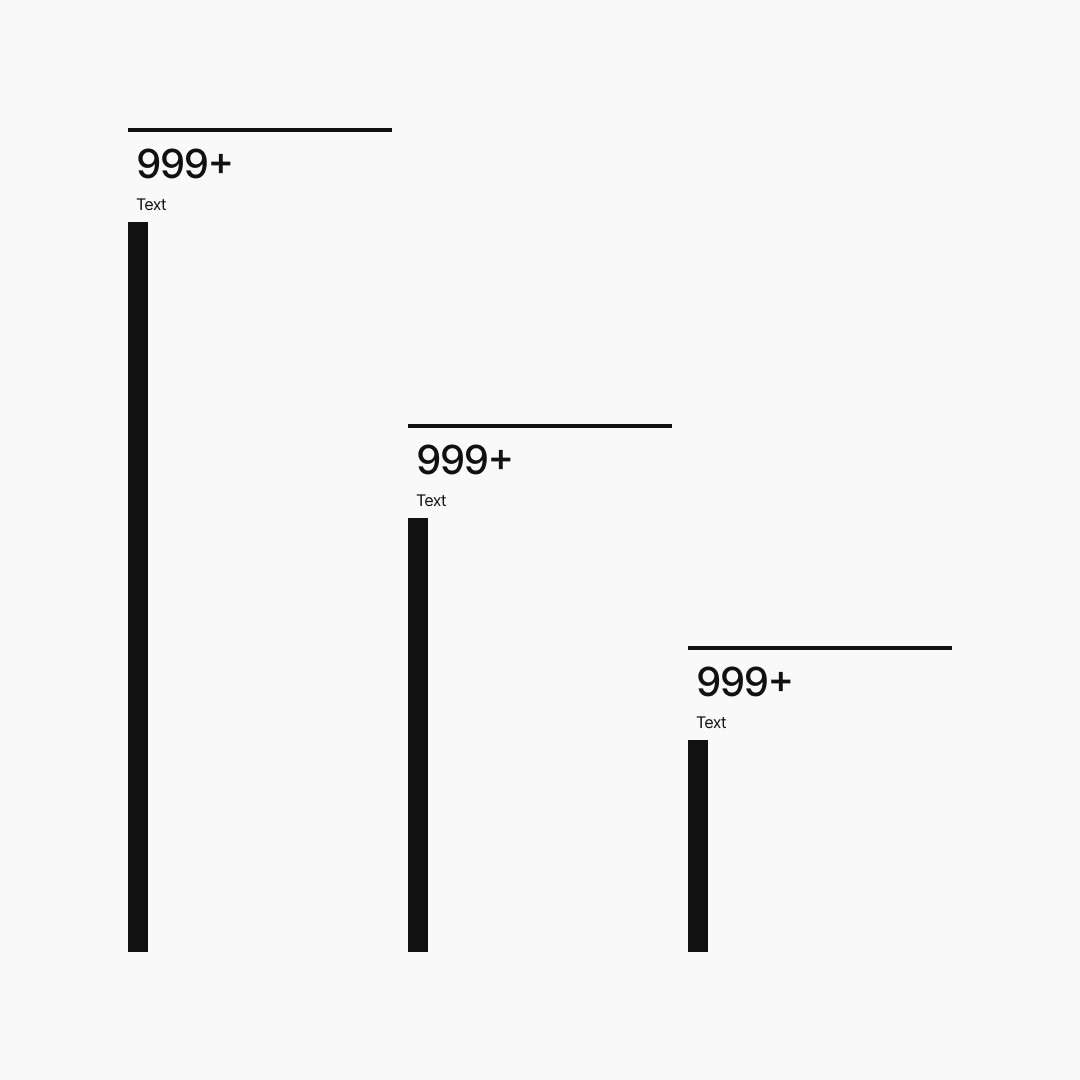
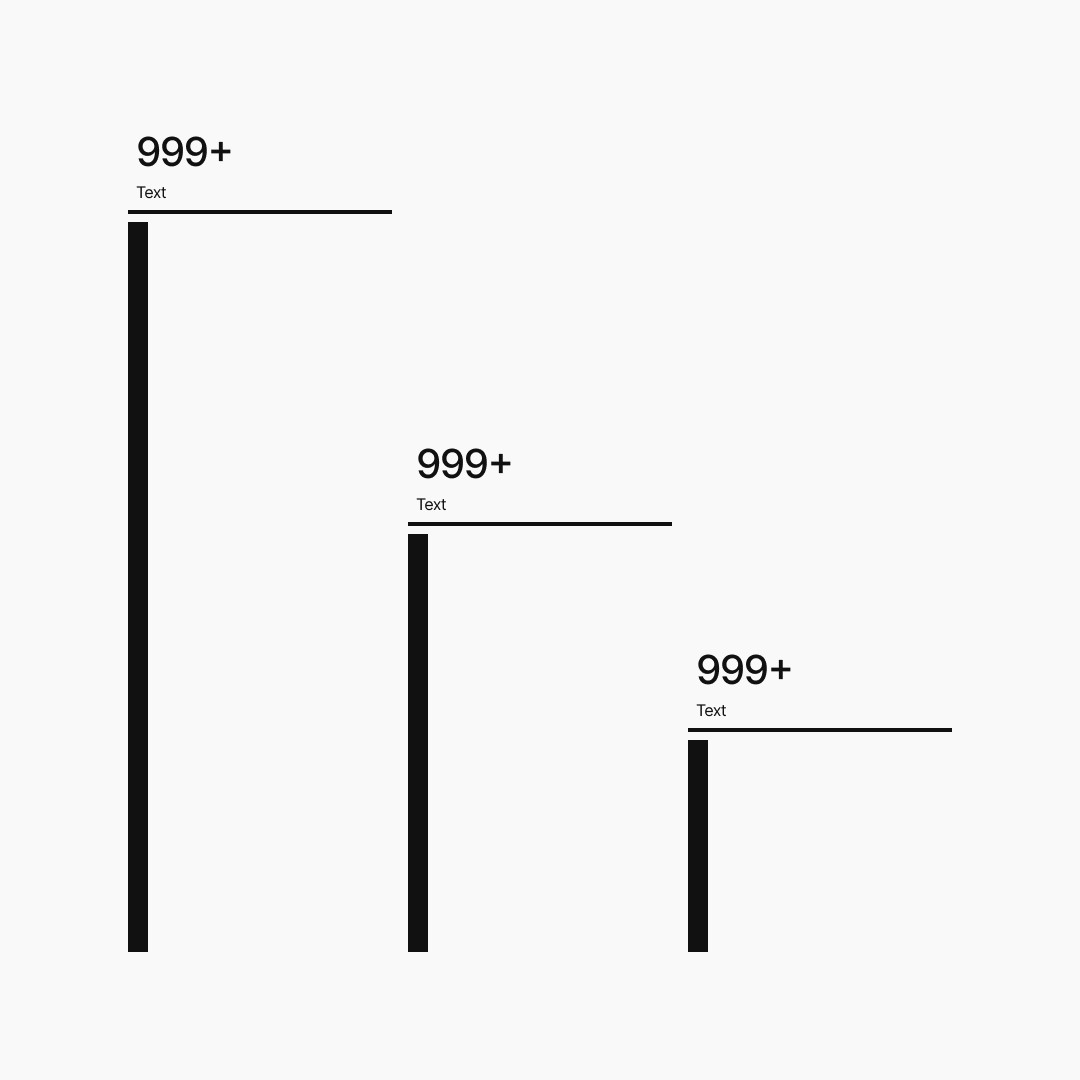
Vertical with filling
Vertical with filling
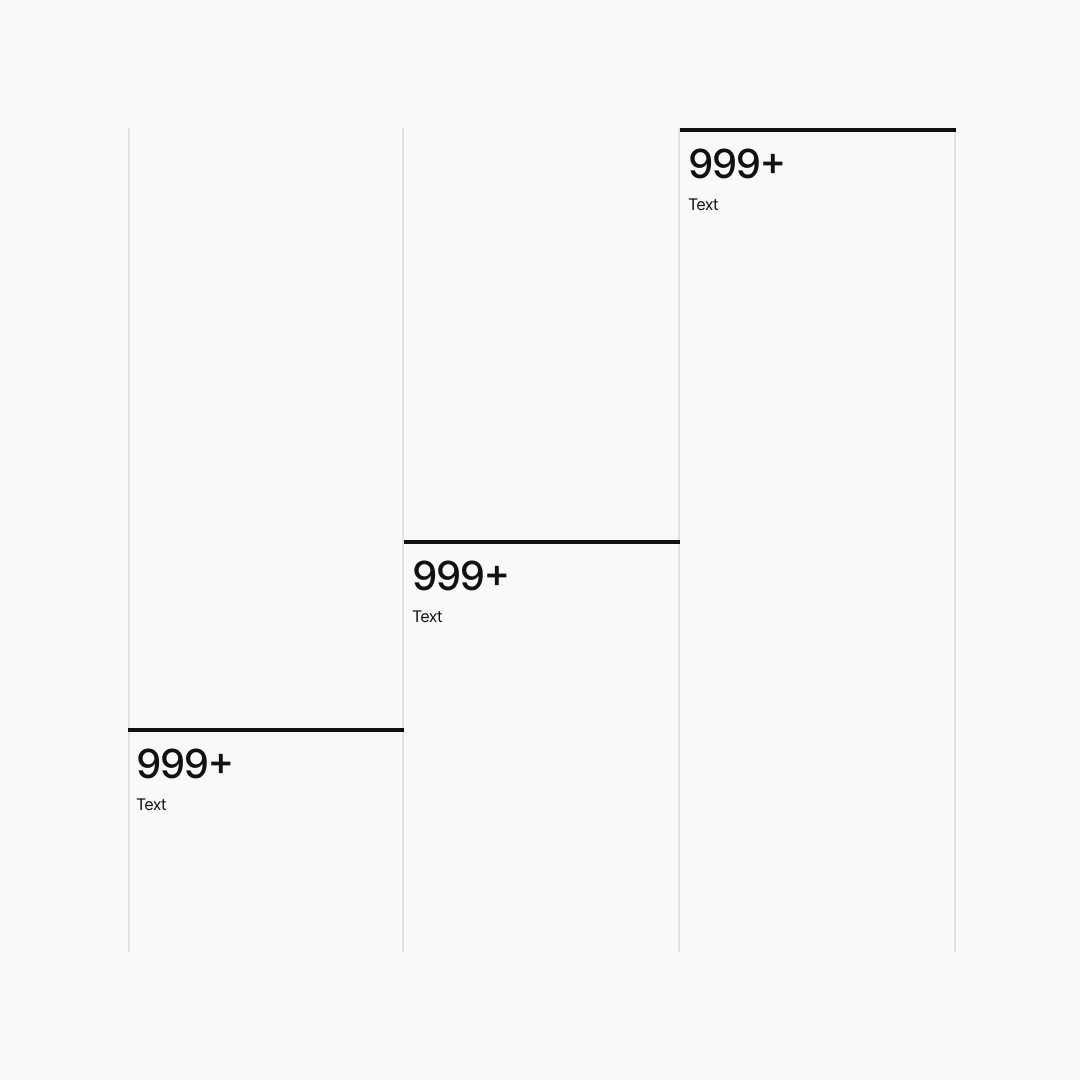
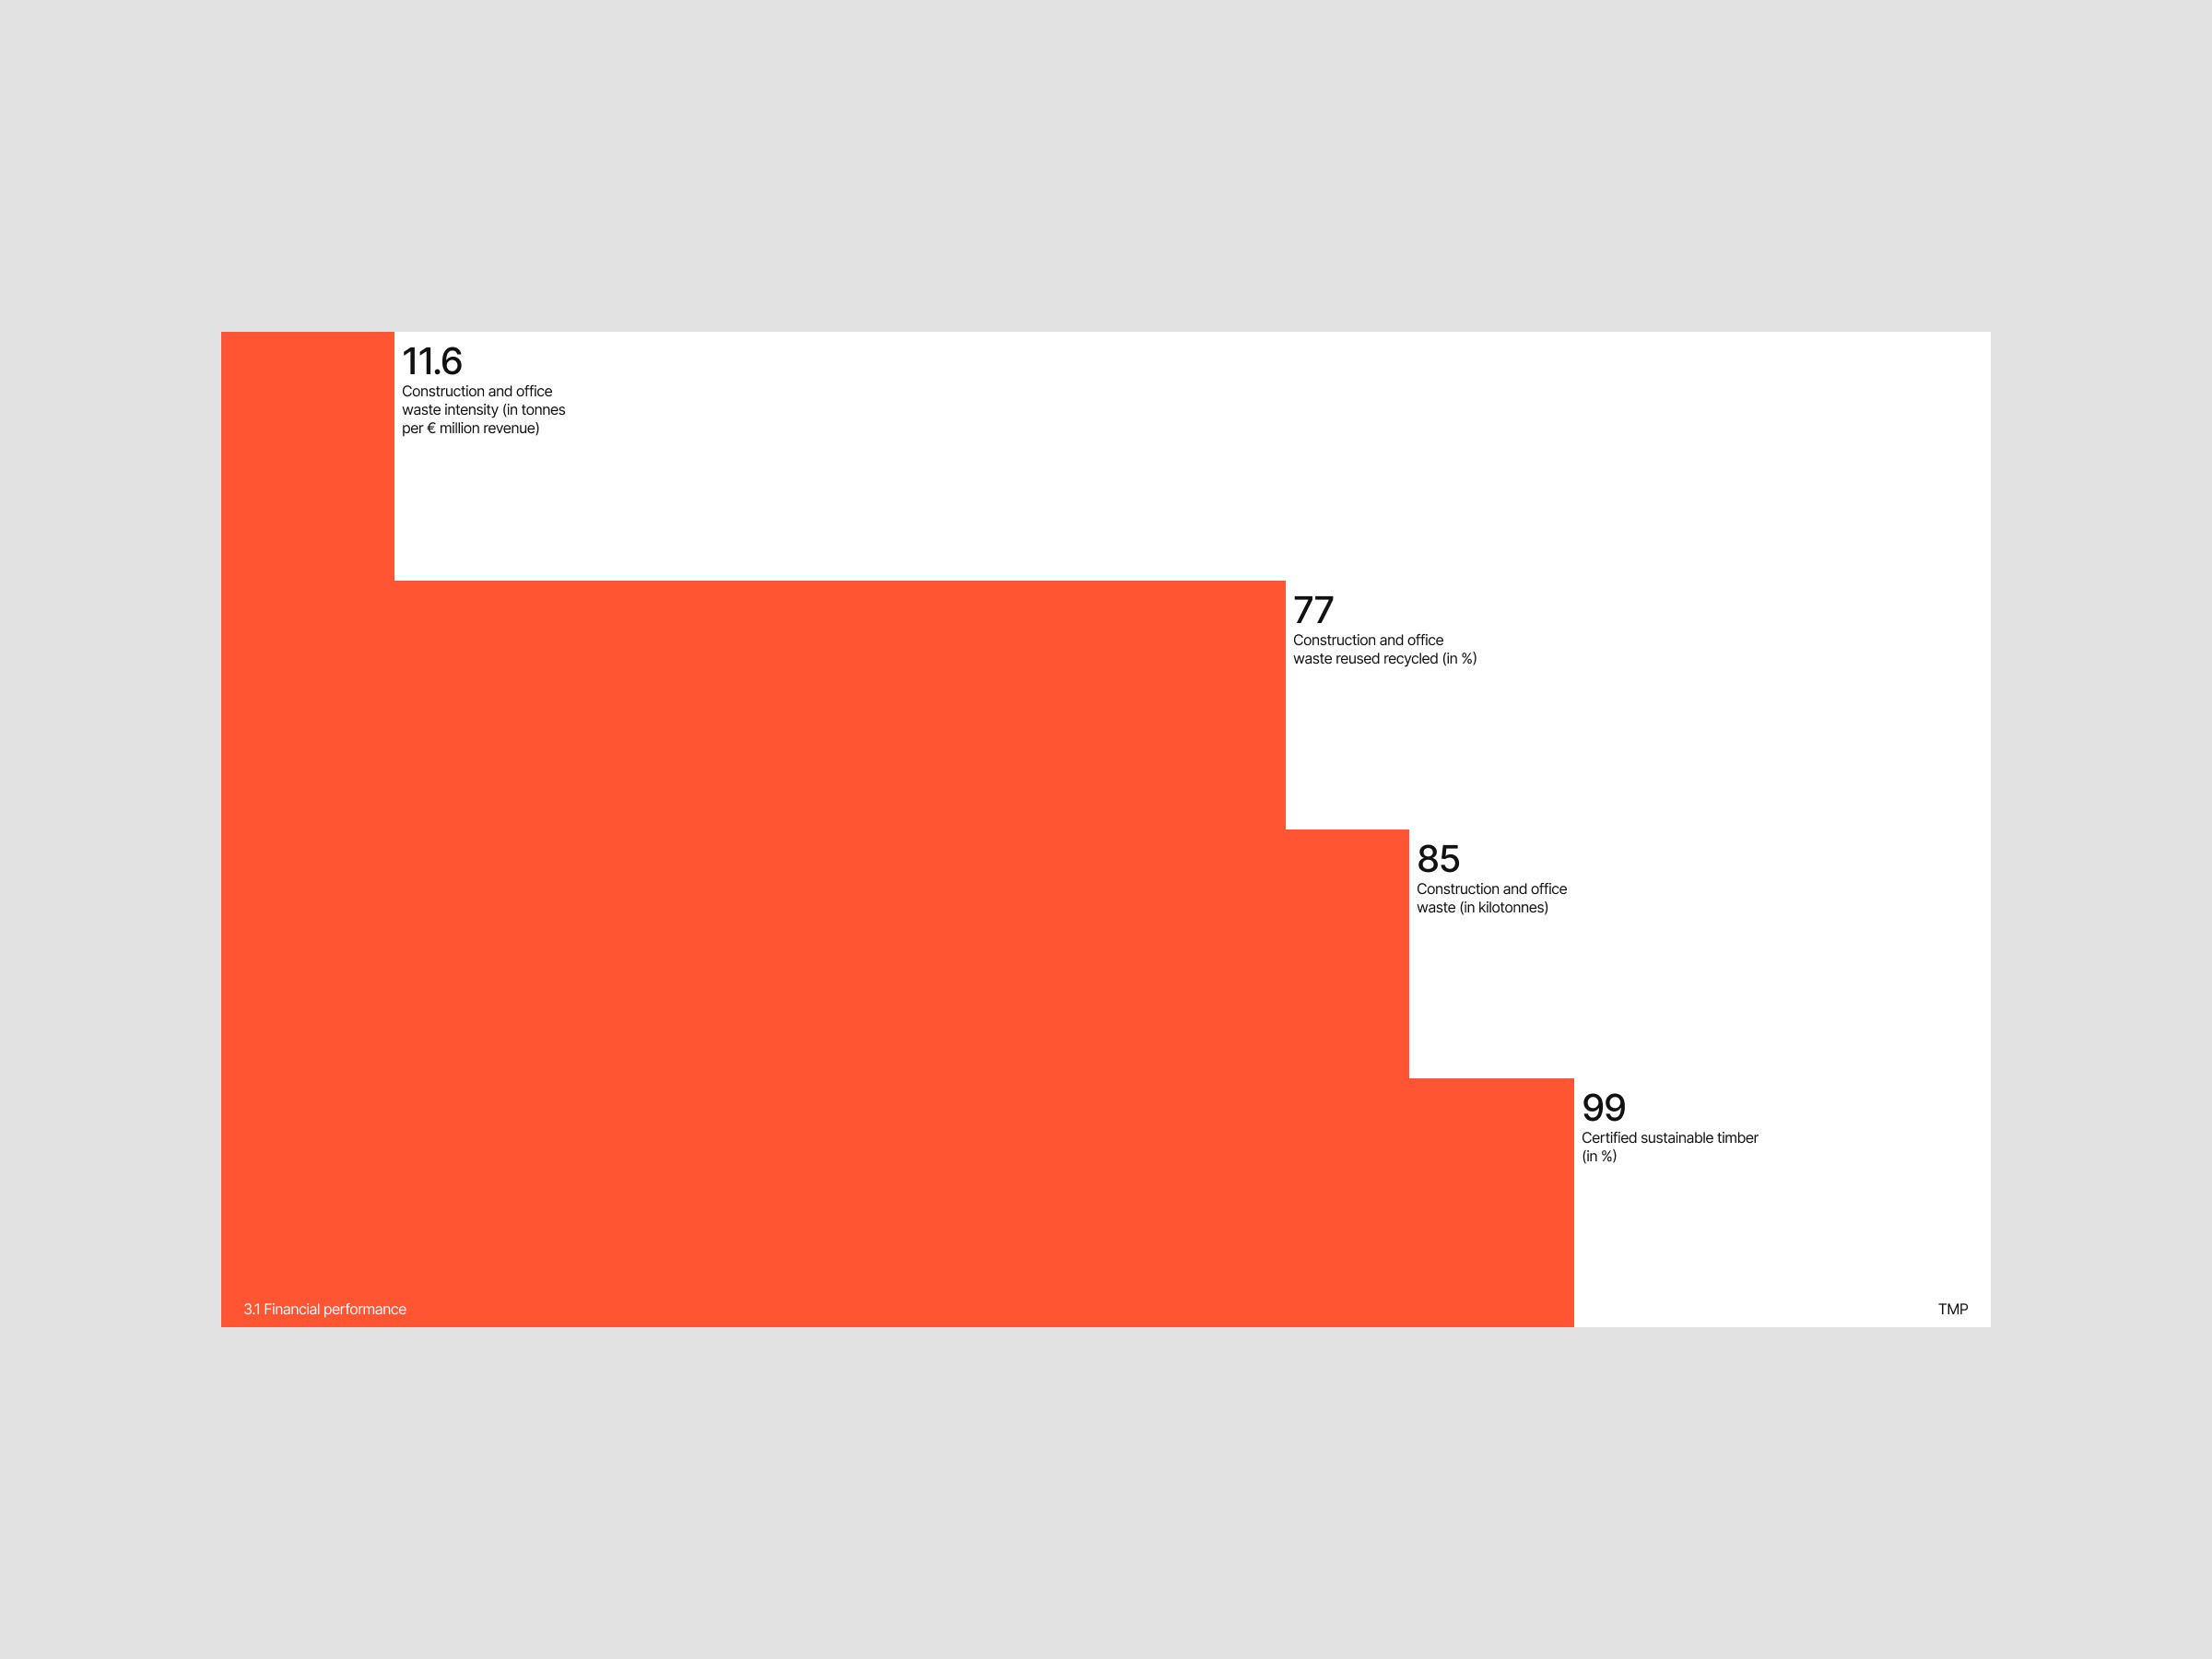
Horizontal with stroke

Horizontal with filling
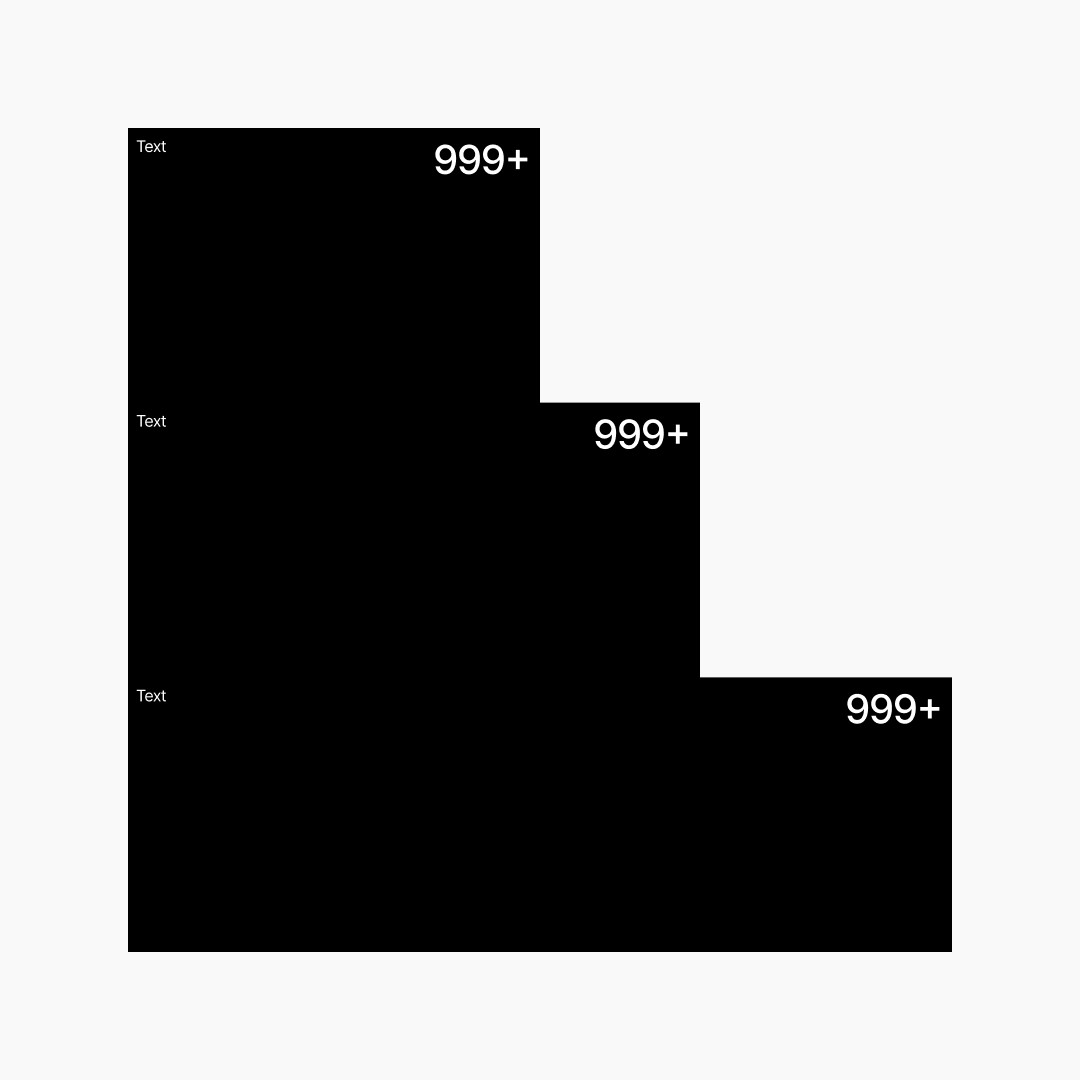
Horizontal with filling
Linear v1
Linear v2
Linear v3
Combined v1
Combined v2
Combined v3
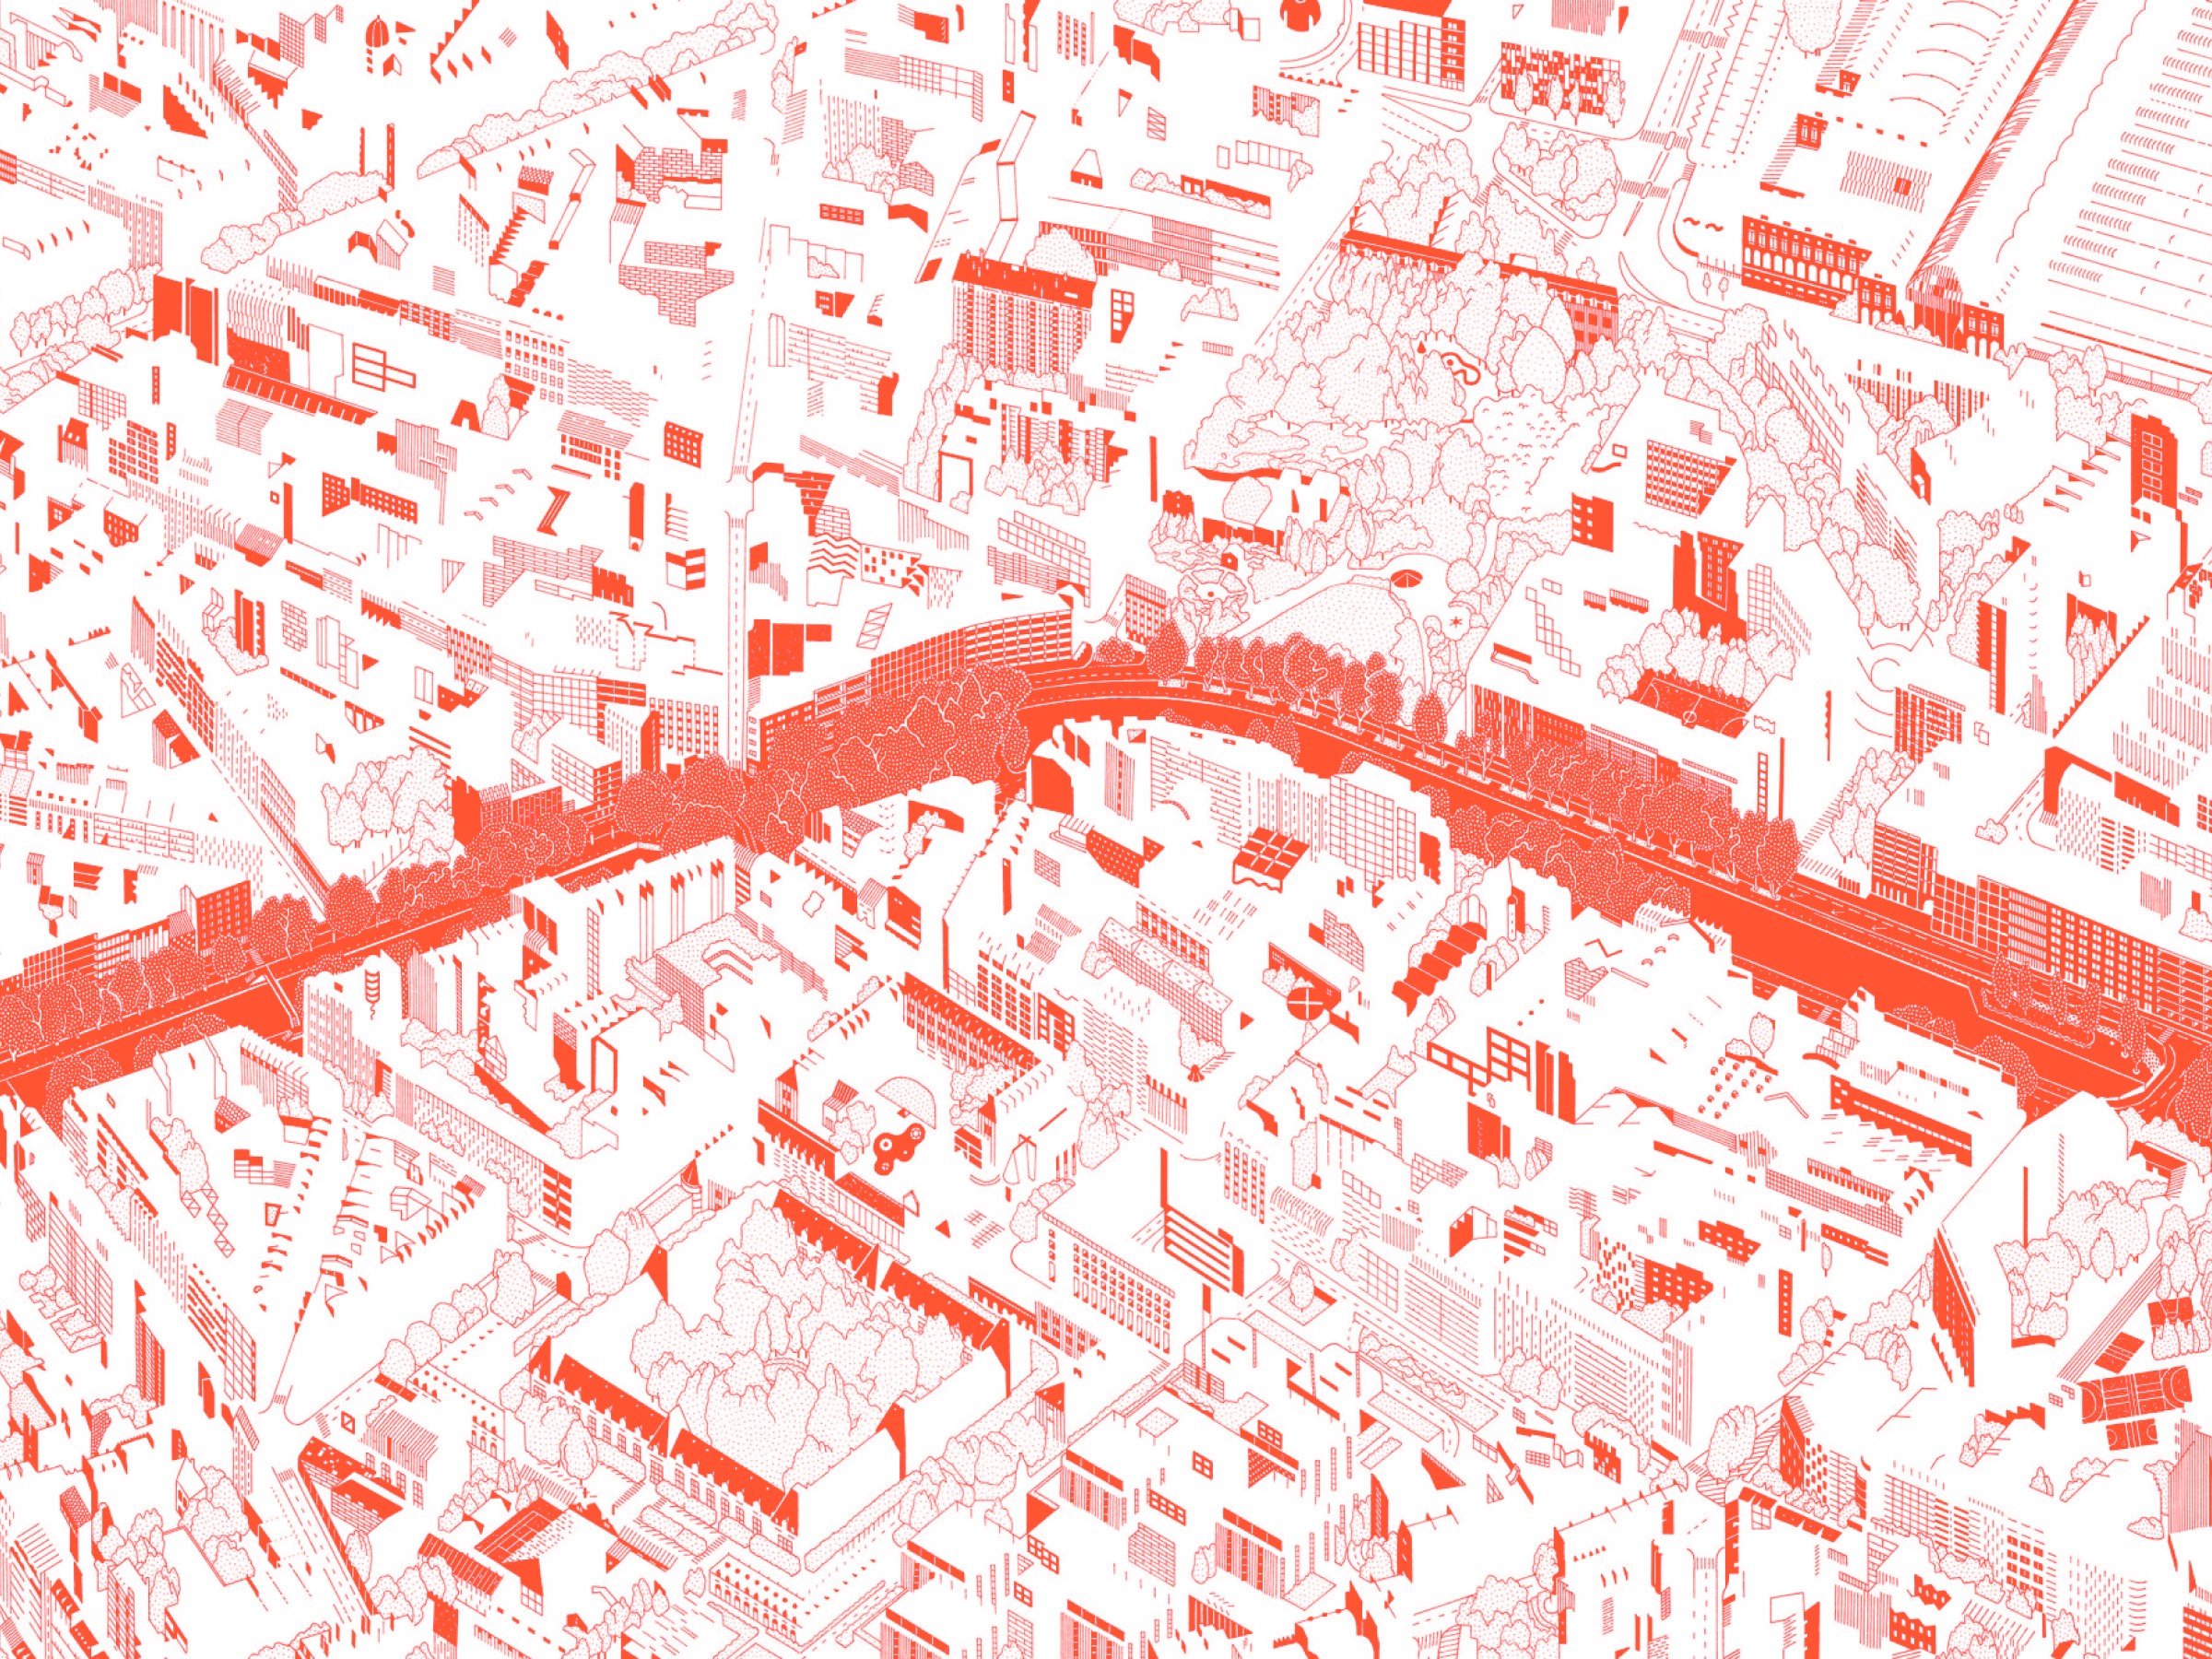
Area map
Filled
Linear
Filled
Linear
Bubbles
Filled
Linear
Circle map
Arrows / points
Simple and elegant arrows, with dot as points.

Variant 1

Variant 2

Variant 3
Examples
Previous
Next
